
Rhode Island’s slow rate of housing construction compared to its peers has been identified as a leading contributor to the state’s quickly-rising housing costs. In this post, I unpack construction trends in RI to better understand our housing supply challenges, with a particular focus on understanding “where” and “what kind” of homes are being built, not just “how many”.
Tracking the geographic and building characteristics of our housing pipeline is worthwhile because following a more compact “Smart Growth” development pattern instead of a sprawling one can produce an array of social, economic, and environmental benefits. Sprawl, characterized by low-density greenfield development of 1-unit buildings on the edges of urban areas, tends to eat up more natural land, lock in more car dependency and traffic, and create more public infrastructure liabilities per new housing unit compared to Smart Growth, a pattern in which primarily infill development of a variety of building types supports proximity to neighborhood services and economic opportunities.
As recognized by our most recent statewide land use plan, Land Use 2025, Rhode Island’s unique identity as a state comes in part from our compact & clustered pattern of historic towns and villages, an identity which is actively being eroded by the sprawling low-density development that took over RI and many other communities in the late 20th century. However, early housing construction indicators from 2024 and early 2025 hint that RI may be starting to turn away from sprawl and back toward a more compact development pattern.
Key Takeaways
- For most of the past decade, RI has sprawled, with new housing units heavily focused in low-density towns and dominated by 1-unit buildings, continuing a pattern that dates back to at least the 1970s.
- 2024 was the first year in at least a decade when most new homes in RI were started in more urban areas rather than in lower-density towns where acre-plus lot sizes are the norm.
- 2024 was the first year in at least a decade when most new homes in RI consisted of multifamily housing rather than single-family structures.
- An outsized portion of the new 2-4 unit building starts in RI are in the city of Providence, where small-scale residential construction activity on previously vacant lots has surged past pre-recession levels.
Data Sources
Warning: this section is somewhat technical! Feel free to skip ahead to the next one if data details don’t interest you.
Most of the data for this analysis come from the US Census’ Building Permit Survey (BPS), which publishes monthly counts of housing units by structure type that receive permits to begin construction, as reported by municipalities. However, this survey only captures homes that are added through new construction, not from conversions or renovations. Hence, housing permitting numbers based on BPS data are lower than what is reported by the RI Department of Housing using their own surveys and additional data sources. The main advantages of BPS data are that they offer better comparability between communities and over time. The survey has existed for decades, but in this post I focus on trends from 2013 (the earliest year of BPS data in its “Detailed Revised Monthly” series) through May 2025.
Another aspect of the housing supply not captured by BPS data is the effect of demolitions and other losses of housing units, for which high-quality data are usually only collected ad-hoc by municipalities (if at all) and aren’t typically accessible to the public. To understand the hyper-local geography of the housing pipeline in Providence, I used property tax roll data (published annually on the city’s open data portal) to infer both construction and demolition activity at the parcel level.
Finally, for reference mapping layers and existing housing totals from the 2020 decennial census, I used data curated by the Ocean State Spatial Database and MassGIS. I also pulled some 2023 5-year American Community Survey data on housing by structure type from the US Census API.
The full R code for this analysis is available at https://github.com/mciethan/routed-in-place-blog/tree/main/20250713_ri_buildingpermits
Where is new housing being built in RI?
One indicator of a region’s development pattern is the geographic distribution of new housing units. In more rural towns with few existing homes per land area, new housing is more likely to contribute to sprawl, while new housing in more urban communities is more likely to be compact infill development.
For this analysis, I grouped Rhode Island’s towns into one of three housing density categories. “Low-density” towns have more than 1 acre of land per home on average, “high-density” towns have less than a quarter of an acre of land per home on average, and “medium-density” towns fall in between. These thresholds are consistent with the housing density categories used in Land Use 2025, and conveniently, each of these groups of towns make up about a third of Rhode Island’s existing homes as of 2020.
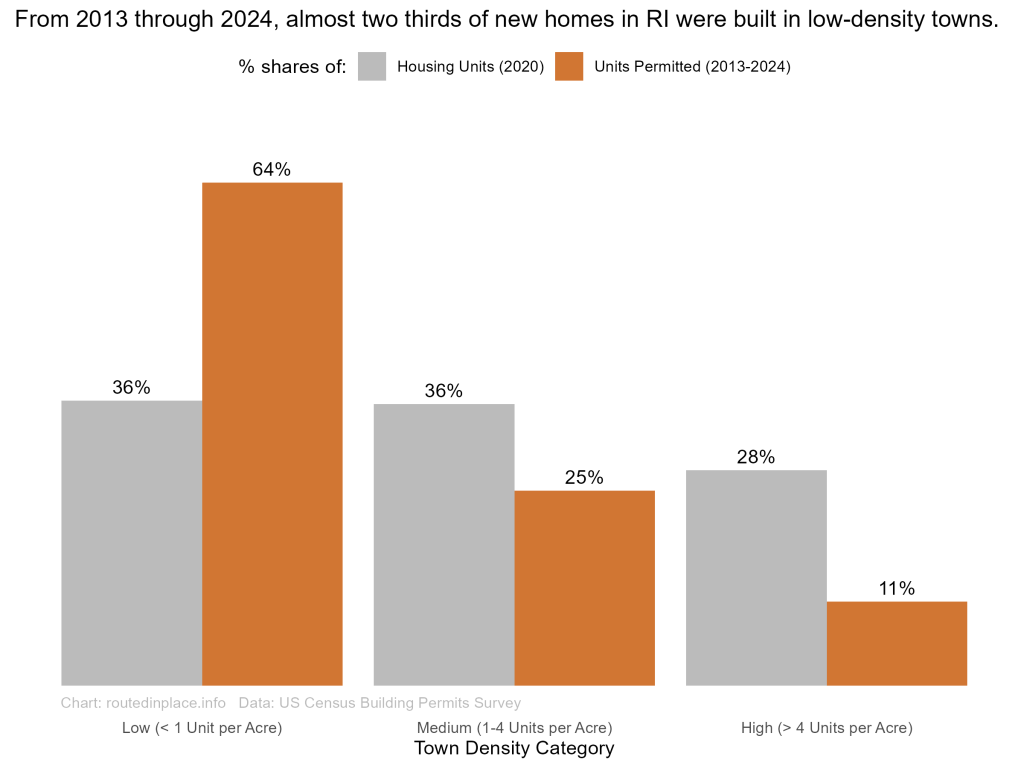
From 2013 through 2024, almost two thirds of all new homes in RI were in low-density towns, while just 11% of new homes were started in high-density towns. This heavy focus on new homes in low-density towns, combined with the fact that many RI towns are zoned with large minimum lot sizes, suggests that the state’s current development pattern is largely continuing the sprawl that Land Use 2025 warned against.
However, housing construction rates vary widely across Rhode Island’s municipalities, even within these town density categories. A common way to compare housing permitting rates across towns of varying sizes is to express the number of new units as a portion of either the population or the number of existing homes. Relative to their existing housing stocks, Rhode Island’s urban core communities have systematically lower rates of housing production than the state’s outlying lower-density towns.
Click link or image to open an interactive chart of housing density & permitting rates
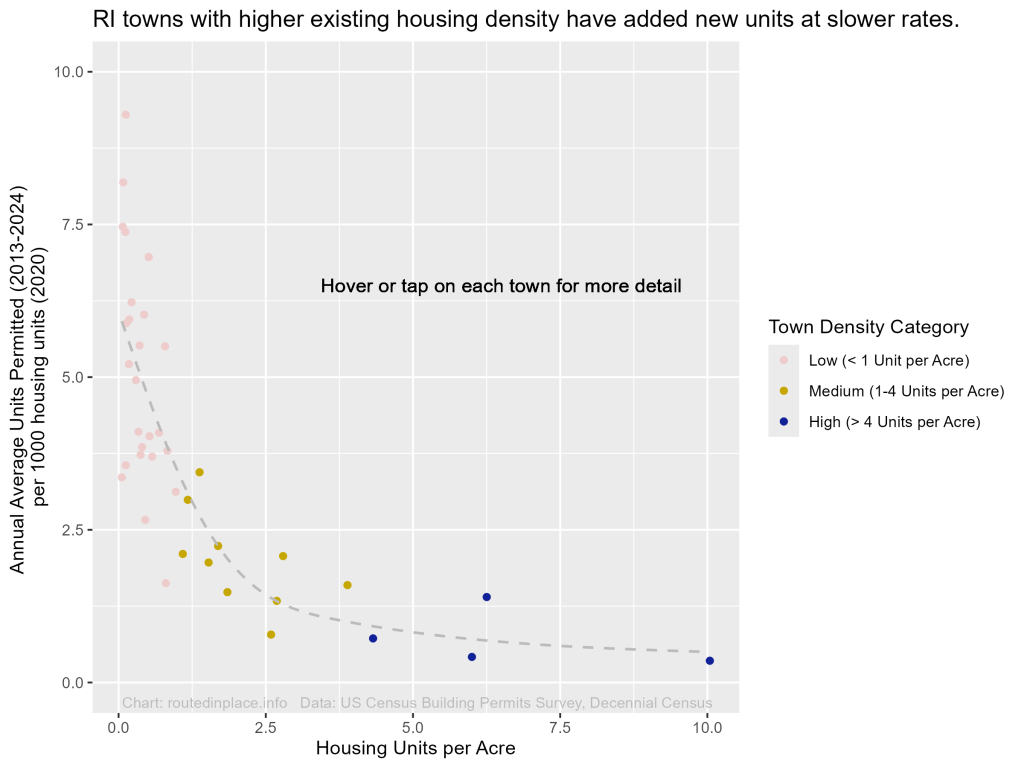
One point worth emphasizing is that it is by no means an inherent tendency of metro areas to build homes faster in less dense areas like Rhode Island has been doing. For example, in the Boston area, an outsized portion of housing construction occurs in the urban core. Communities like Boston, Cambridge, Chelsea, Everett, and Winthrop all have higher existing housing densities than the city of Providence while adding new homes at average annual rates of between 7.3 and 11.6 permitted units per 1000 existing units from 2013 through 2024, more than five times faster than Providence’s housing permitting rate during that time (1.4). Even outside the ultra-high-demand inner core of the Boston area, cities like Worcester (4.4) and Lowell (3.3) have stronger housing pipelines than similar urban areas in RI.
Rhode Island has a long way to go in restoring a healthy level of new housing construction relative to demand, particularly in urban areas. However, recent trends show that the state’s housing pipeline is inching upward, and notably, those recent increases in new homes are predominantly in medium- and high-density towns.
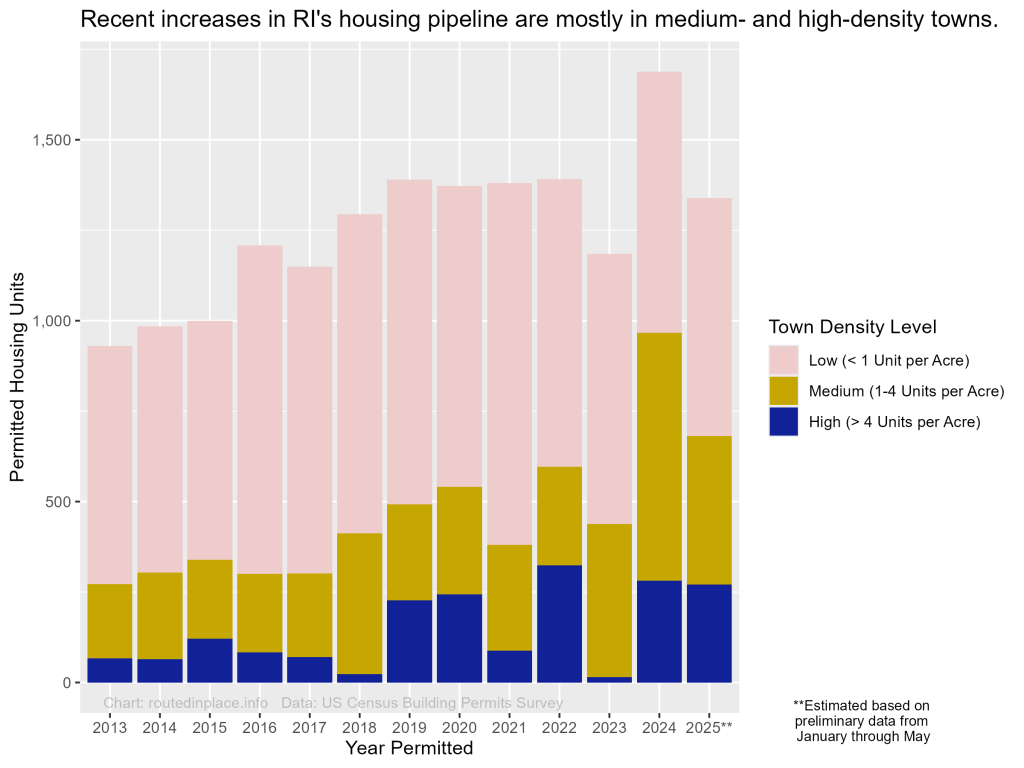
In 2024, for the first time in at least a decade, more new homes in RI got construction permits in medium- and high-density towns than in low-density ones. Data from the first part of 2025 suggest that the number of new construction permits will likely be lower than in 2024, but that a majority of those new homes will continue to be in the state’s more urban areas rather than in its low-density towns.
What kinds of housing are being built in RI?
Another important indicator of a region’s development pattern is the mix of detached single-family buildings vs multifamily buildings in the housing supply. New multifamily housing tends to support compact “Smart Growth” development by allowing households to save on land and energy costs while living near neighborhood services, economic opportunities, and extended family or friends. Many of Rhode Island’s iconic triple-deckers were built as an affordable means of homeownership for working families in the late 1800s in response to that era’s sharp population and job growth, and multifamily buildings will continue to be key in addressing the state’s current housing affordability challenges amid today’s context of shrinking household sizes and an aging population.
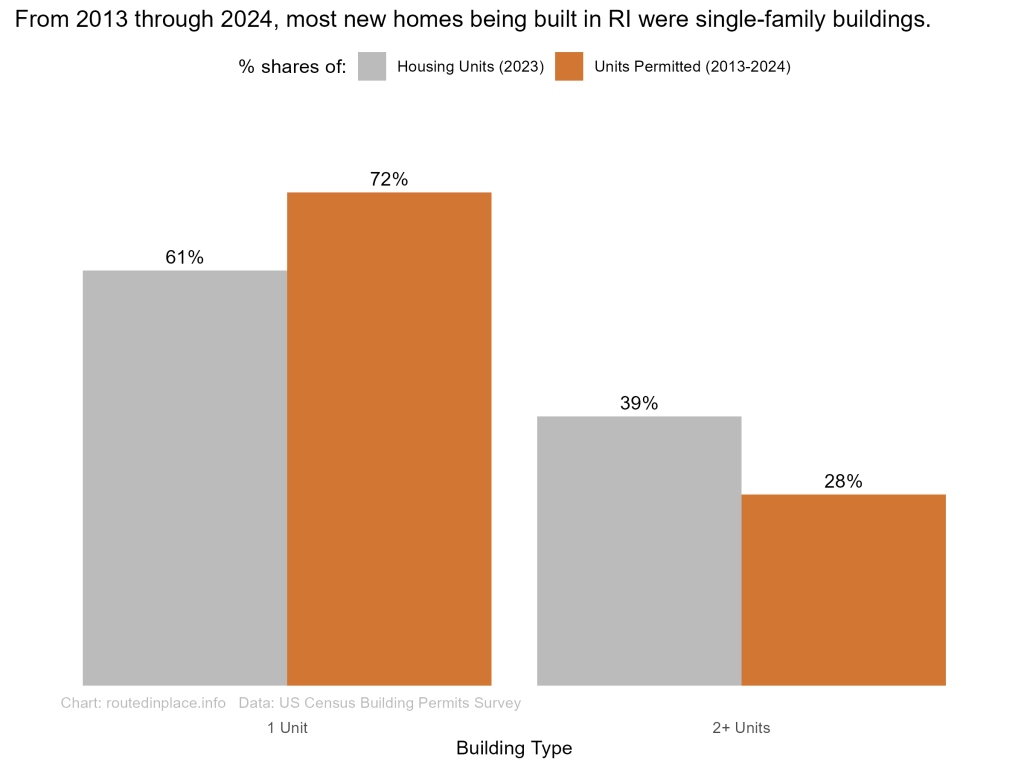
From 2013 through 2024, almost three quarters of new homes in RI were 1-unit buildings, a greater portion than the state’s existing homes as of 2020. A major contributor to this pattern is the fact that many towns in RI, even ones having public water and sewer infrastructure, do not allow any multifamily housing to be built by right. However, there is a high degree of variation among individual RI municipalities in terms of multifamily housing development.
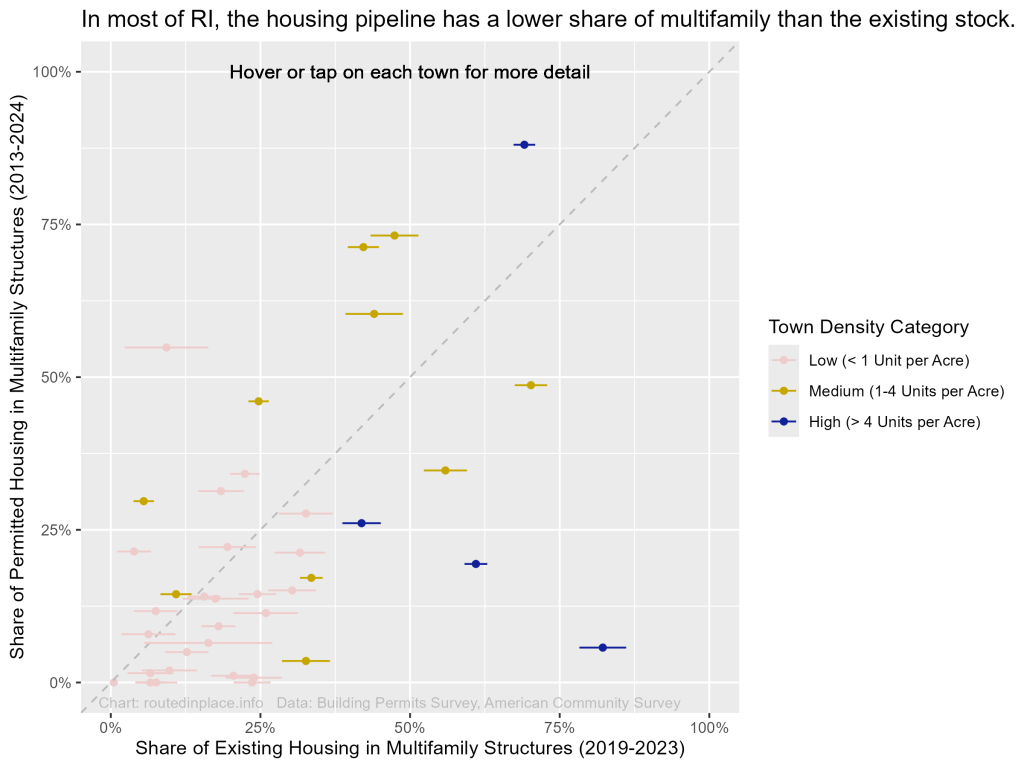
Most Rhode Island towns, both low-density and high-density, are slowly increasing their shares of single-family homes, having lower shares of multifamily housing among the units they permitted 2013 through 2024 than they do in their existing housing stocks. In fact, four towns (Foster, Johnston, Little Compton, and Scituate) saw 0 construction starts of new multifamily homes during this 12-year period.
However, many towns in RI increased their multifamily shares of housing, ranging from high-density Providence to low-density Exeter. Interestingly, six out of ten of RI’s medium-density towns in RI added multifamily units proportionately more than their existing housing, with multifamily units representing just under half of existing homes in both East Providence and West Warwick but making up more than 70% of permitted units in those towns from 2013 through 2024.
This high degree of variation between towns underscores the key role of municipal policies in encouraging or discouraging new multifamily housing. However, statewide efforts may have also contributed to the fact that recent increases in Rhode Island’s housing pipeline mostly consist of multifamily housing.
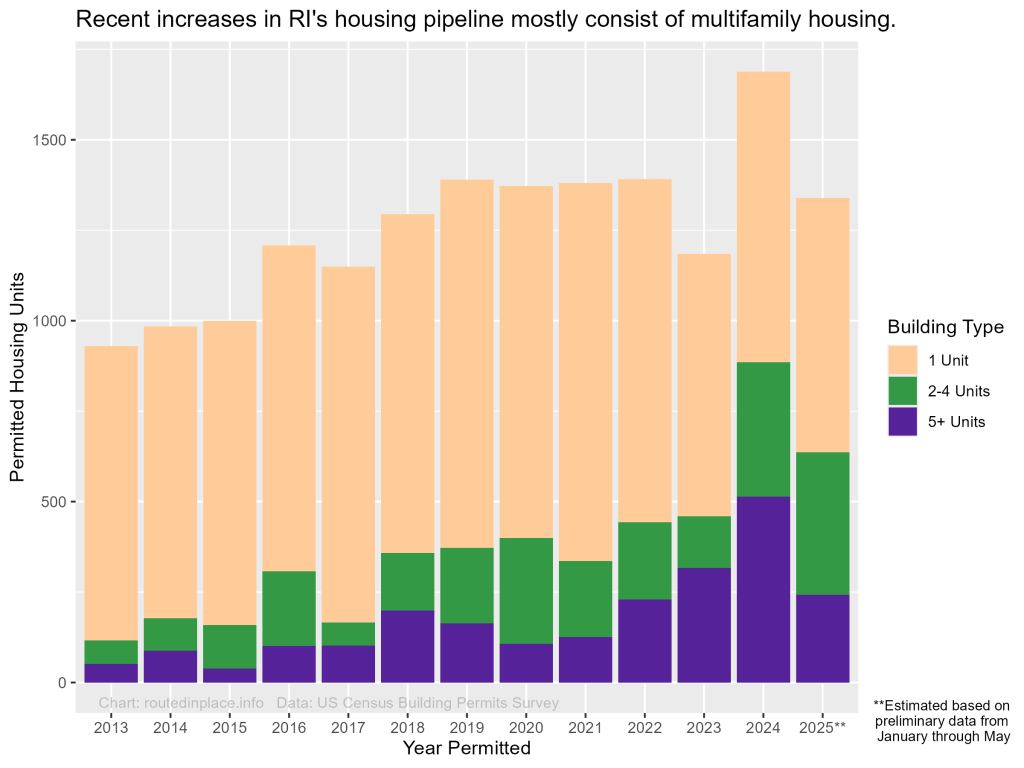
In 2024, for the first time since at least 2013, a majority of permitted units in RI were in multifamily buildings. Early data suggest that 2025 will also be a relatively strong year for multifamily housing permitting, though single-family units represent a slight majority of those permitted so far.
While both 2-4 unit buildings and 5+ unit buildings have contributed to the recent increases in multifamily housing development, it’s worth unpacking these categories, particularly the 5+ unit category, because they contain a huge variety of building types. Do the hundreds of new homes per year in 5+ unit buildings consist of dozens of six-plexes, a few very large apartment buildings, or something in between?
While I can’t answer this question definitively without more granular data, some preliminary web searches suggest that a large portion of the 2023-2024 increase in homes within 5+ unit buildings (and within medium-density towns as a whole) came from just two large projects.
In 2023, an adaptive reuse project converting the former Woonsocket Middle School into 150 new homes began construction. Without this unique project, the number of new homes in 5+ unit buildings in 2023 would have resembled that of previous years rather than showing an increase, and I found no indicators that this project is part of a more continuous pipeline of large apartment buildings being planned for Woonsocket.
In 2024, the groundbreaking of the 214-unit Alta Altitude project in Warwick, close to TF Green International Airport and its MBTA commuter rail station, accounted for almost half of the new homes started in 5+ unit buildings that year. However, the area around the airport entrance and station, which is being branded as “City Centre Warwick“, appears to have more projects of a similar scale coming down the pipeline, suggesting that Warwick will continue to add some large apartment buildings in the years to come.
While the increase in multifamily homes in medium-density towns like Woonsocket and Warwick appears mostly driven by a handful of large projects for now, a different pattern emerges in Providence, which has added some large apartment buildings recently, but where most of the new multifamily units in 2024 consisted of 2-4 unit buildings rather than 5+ unit buildings. In fact, Providence has accounted for an outsized portion of the state’s new 2-4 unit buildings for years, showing that its relatively strong housing pipeline isn’t reliant on a handful of large projects.
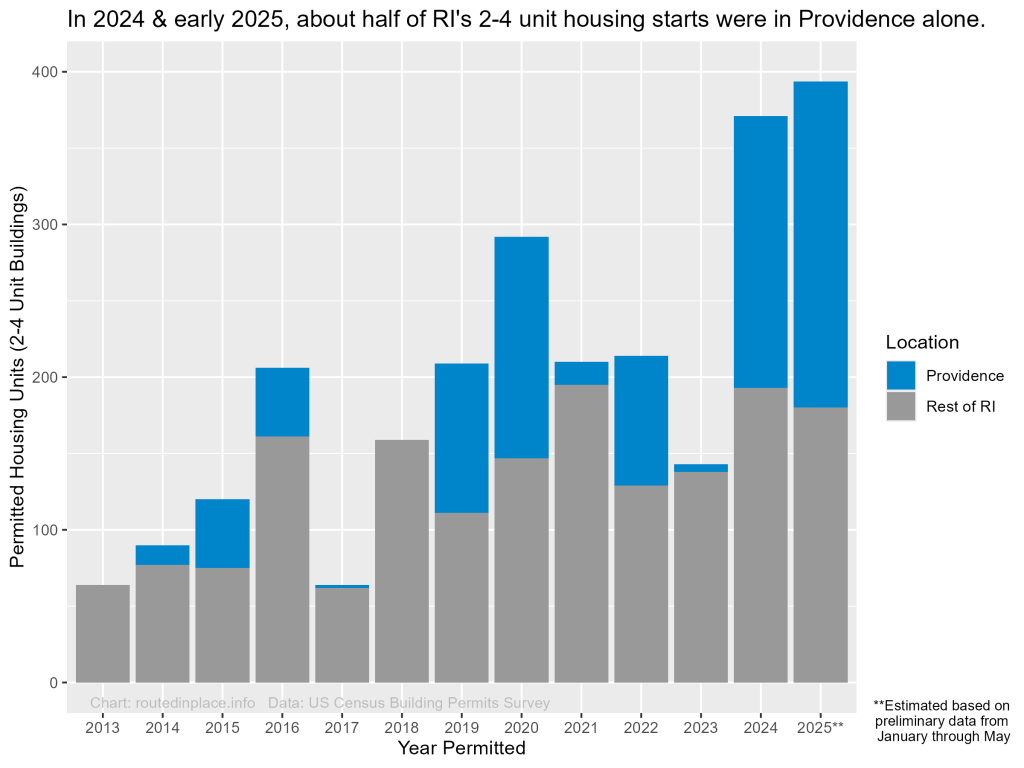
Many communities in RI have sizable existing stocks of triple-deckers and other 2-4 unit buildings, yet in 2024 and in 2025 so far, Providence alone added approximately half of all the new homes in 2-4 unit buildings that were permitted in the state. With higher housing permitting rates than other RI communities of similar density and an outsized portion of the state’s new small-scale multifamily homes, Providence’s housing development is worth a closer look.
When and where has Providence seen recent increases in new homes?
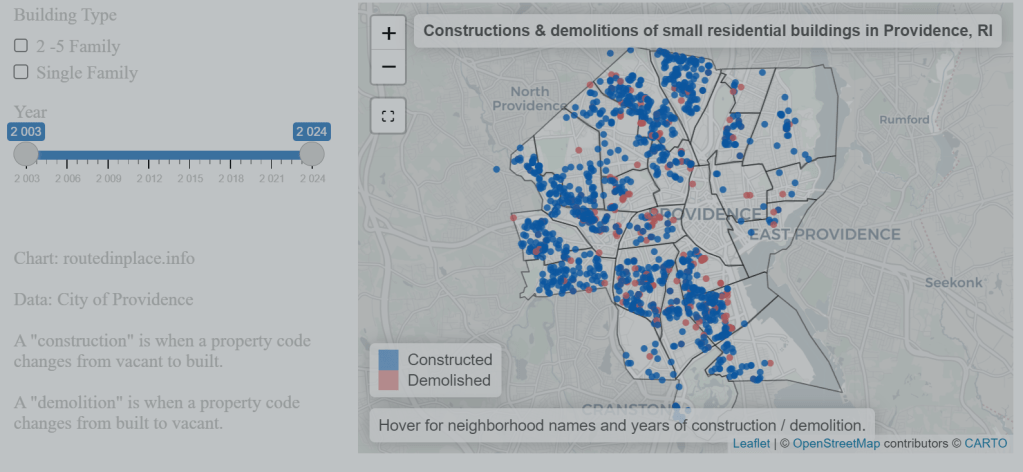
To understand Providence’s housing pipeline in more detail, I inferred construction and demolition activity using annual property tax rolls that the city has published on its open data portal going back to 2002, as described in the technical note below. These data show that the annual construction of small-scale residential properties in Providence has now grown past its peak from before the Great Recession.
Technical Note: Each property is uniquely identified by its plat, lot, and unit, and each one has a code indicating its primary use, making it possible to distinguish vacant lots, 1-unit buildings, and 2-5 unit buildings from each other. For the purposes of this analysis, I counted a “construction” as a property that is labeled as a residential building in one property tax year but which was labeled as vacant during the previous property tax year, and I count a “demolition” as the converse.
Counting constructions and demolitions in this way ensures that we capture the timings of housing completions rather than construction starts as in permit data, but there may be some uncertainty in timing due to any lag between actual construction/demolition and when that’s recorded in the tax rolls. Also, this method likely gives conservative estimates of construction and demolition activity, as it does not account for any use conversions of non-vacant parcels nor for any constructions and demolitions wherein a parcel ID is newly created or dropped from the tax rolls.
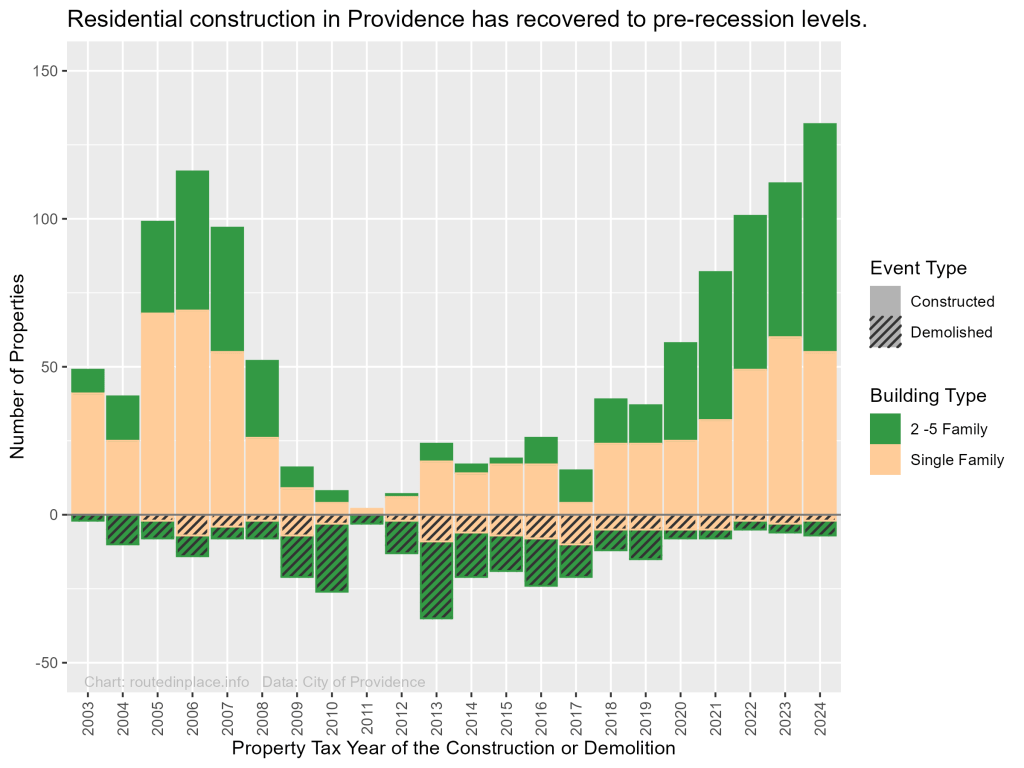
Notably, small multifamily buildings were particularly hard-hit by demolitions for the entire decade after the Great Recession, with Providence seeing more demolitions than new constructions of 2-5 unit buildings every single year from 2009 through 2017. However, 2-5 unit buildings seem to have made a major comeback in Providence during the COVID-19 era, to the degree that 2-5 units buildings now make up a greater share of Providence’s housing pipeline in the 2020s than they did in the pre-Recession 2000s. Providence’s single-family construction totals in the 2020s are at or slightly below what they were pre-Recession, so much of the credit for the fact that the city’s housing pipeline is at a multi-decade high belongs with the recent increase in construction of 2-5 unit buildings on previously vacant lots.
The neighborhood geography of Providence’s small-scale residential construction pipeline also seems to have changed over the past two decades. Prior to 2008, the neighborhoods with the most new 2-5 unit buildings were the West End and Hartford. However, from 2018 through 2024, neighborhoods like Olneyville, Charles, Wanskuck, and Upper South Providence saw notable increases in infill development of 2-5 unit buildings.
Conclusion
While it’s too early to celebrate any victories over the state’s housing crisis, building permit data suggest that Rhode Island is beginning to restore its pipeline of new homes. Furthermore, the recent increases are not doubling down on the state’s sprawl problem but instead are being driven by multifamily infill development in more urban parts of the state, particularly the city of Providence. Time will tell whether the spate of housing-related laws passed by state leaders during the 2023, 2024, and 2025 legislative sessions will add up to more permanent increases in the state’s housing supply to help alleviate pressing affordability issues and contribute to a more sustainable “Smart Growth” development pattern.

Leave a comment